Recently, I saw a reference to an interesting piece from 2013 by Peter Grogono, a computer scientist now retired from Concordia University. It's to do with checking the "quality" of a (pseudo-) random number generator.
Specifically, Peter discusses what he calls "The Pickover Test". This refers to the following suggestion that he attributes to Clifford Pickover (1995, Chap. 31):
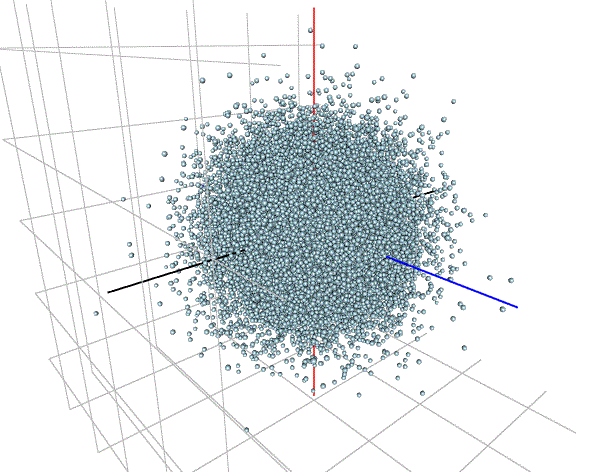
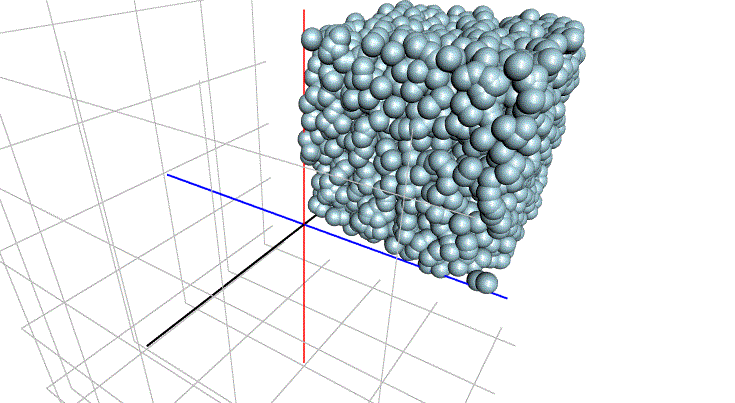
"Pickover describes a simple but quite effective technique for testing RNGs visually. The idea is to generate random numbers in groups of three, and to use each group to plot a point in spherical coordinates. If the RNG is good, the points will form a solid sphere. If not, patterns will appear.
Peter provides some nice examples of such pretty pictures!When it is used with good RNGs, the results of the Pickover Test are rather boring: it just draws spheres. The test is much more effective when it is used with a bad RNG, because it produces pretty pictures."
I thought that it would be interesting to apply the Pickover Test to random numbers produced by the (default) RNG's for various distributions in R.
Before looking at the results, note that is the support of the distribution in question is finite (e.g., the Beta distribution), then the "solid sphere" that is referred to in the Pickover Test will become a "solid box". Similarly, if the support of the distribution is the real half-line (e.g., the Chi-Square distribution), the "solid sphere" will become a "solid quarter-sphere".
You can find the R code that I used on the code page that goes with this blog. Specifically, I used the "rgl" package for the 3-D plots.
Here are some of my results, in each based on a sequence of 33,000 "triplets" of random numbers:
(i) Standard Normal (using "rnorm")
(ii) Uniform on [0 , 1] (using "runif")
(iii) Binomial [n = 100, p = 0.5] (using "rbinom")

(iv) Poisson [mean = 10] (using "rpois")

(v) Standard Logistic (using "rlogis")

(vi) Beta [1 , 2] (using "rbeta")

(vii) Chi-Square [df = 5] (using "rchisq")

(vii) Student-t [df = 3] (using "rt")

(viii) Student-t [df = 7] (using "rt")

(Note that if you run my R code you can rotate the resulting 3-D plots to change the viewing aspect by holding the left mouse key and moving the mouse. You can zoom in and out by "scrolling".)
On the whole, the results look pretty encouraging, as you'd hope! One possible exception is the case of the Student-t distribution with relatively small degrees of freedom.
Of course, the Pickover "Test" is nothing more than a quick visual aid that can alert you to possible problems with your RNG. It's not intended to be a substitute for more formal, and more specific, hypothesis tests for the distribution membership, independence, etc., of your random numbers..
Of course, the Pickover "Test" is nothing more than a quick visual aid that can alert you to possible problems with your RNG. It's not intended to be a substitute for more formal, and more specific, hypothesis tests for the distribution membership, independence, etc., of your random numbers..
Adler, D., D. Murdoch, et al., 2017' 'rgl' package, version 0-98.1.
Pickover, C., 1995. Keys to Infinity. Wiley, New York.
It does in fact seem that this test is not very sensitive to distributions with heavy tails.
ReplyDeleteOne test I have seen was to see if you RNG is doing a good job or not is to repeatedly generate samples of size n, B times from some distribution, and then run a KS test on each of those samples from your parent distribution and see if the p-values form a uniform distribution.
Yes - there's lots of formal testing that you can do. This is just a quick visual check - nothing more.
DeleteThat's one of the tests R actually does for its random number generators -- using Massart's inequality, which is the best bound for the one-sample KS-statistic without assuming continuity.
DeleteHere are some links from a colleague of mine who has studied random number generators since the early 80's. You might be interested.
ReplyDeletehttp://www.sciencedirect.com/science/article/pii/S0378475416301227
here's a reference
MaD0: An Ultrafast Nonlinear Pseudorancom Number Generator," (with Jie Li and Jianliang Zheng), ACM Transactions on Modeling and Computer Simulation, Vol 26, Issue 2, 2016, Article #13
"A New Empirical Test for Parallel Pseudorandom Number Generators," (with Yufeng Liang),Proceedings of IMACS '99, Math. and Computers in Simulation, 55 (2001) 149-158.
A more intuitive ways to visualize patterns in bad RNGs are shown here.
ReplyDeleteStrange Attractors and TCP/IP Sequence Number Analysis
http://lcamtuf.coredump.cx/oldtcp/tcpseq.html
Strange Attractors and TCP/IP Sequence Number Analysis - One Year Later
http://lcamtuf.coredump.cx/newtcp/
Thanks - very helpful. Not sure if this is MORE intuitive though.
ReplyDelete